Advanced Sequence Diagrams for Distributed Systems

Sarah Chen
Tech Lead
Sequence diagrams are indispensable when designing distributed systems. They excel at visualizing the dimension of time and the specific order of operations between different services. In a microservices environment, where a single user action might trigger a cascade of HTTP requests, Kafka messages, and database transactions, a clear sequence diagram is often the only way to truly understand the system.
The Anatomy of a Sequence Diagram
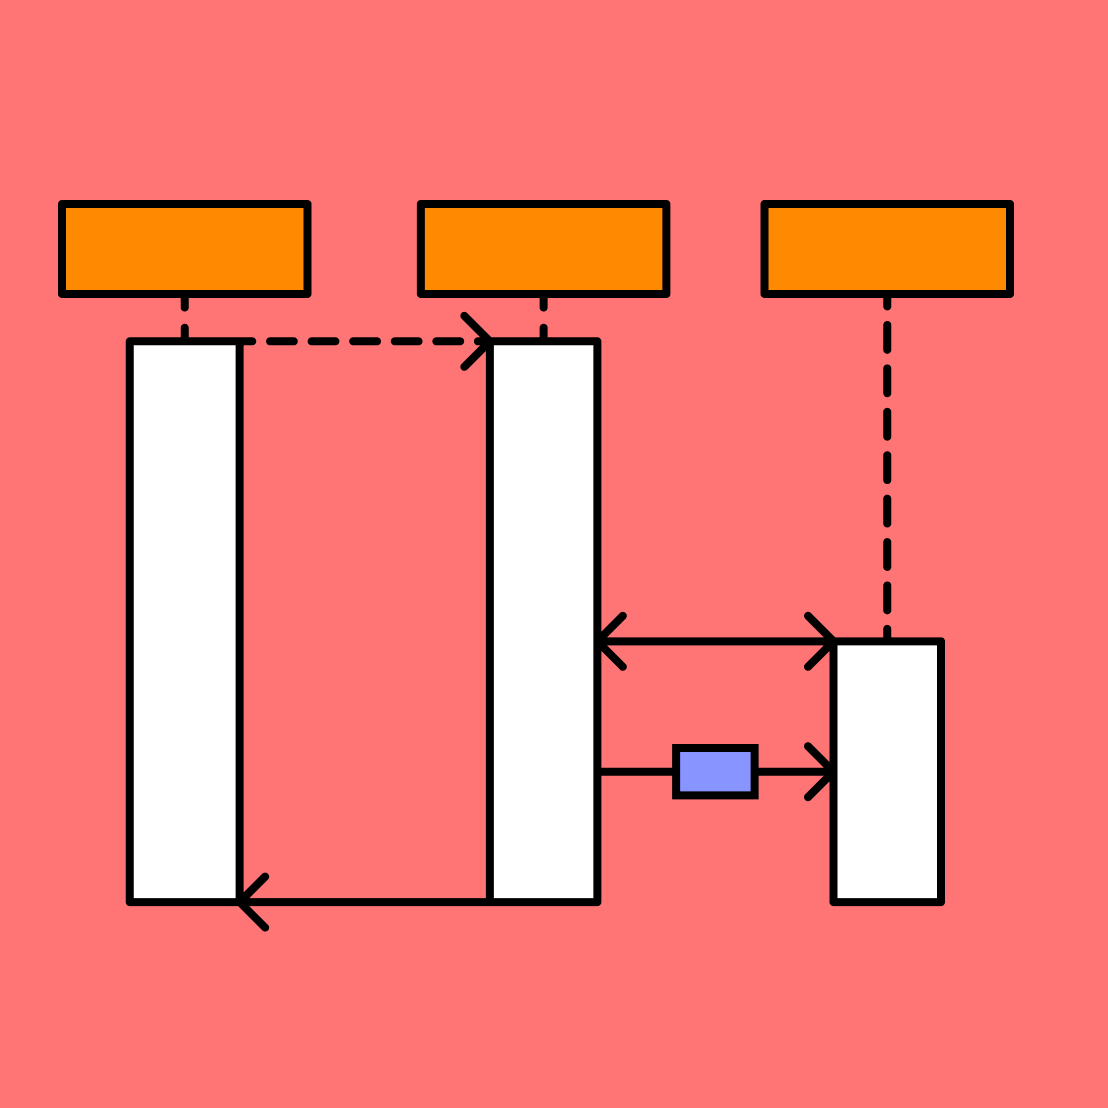
A sequence diagram consists of 'Participants' (the services or actors) and 'Messages' (the lines between them). The vertical axis represents time, proceeding downwards. Mermaid provides distinct syntax for synchronous requests (`->>`), asynchronous messages (`-)`), and return messages (`-->>`).
- **Solid Line Arrow (`->`)**: Standard request (Sync).
- **Dotted Line Arrow (`-->`)**: Standard response.
- **Solid Line Open Arrow (`-`)**: Async message (fire and forget).
- **Activation (`activate`/`deactivate`)**: Shows when a participant is actively processing logic.
Modeling an eCommerce Checkout Flow
Let's look at a comprehensive example involving a user purchasing an item. This involves checking inventory, processing payment via a third-party gateway, and handling potential failures gracefully.
Note: The `critical` block shown above is essential for documenting transactions that must happen atomically. If the payment fails, we explicitly show the compensating transaction (`Release Reservation`) to the Inventory Service. This level of detail is what prevents inventory drift bugs.
Loops and Asynchronous Background Jobs
Not everything happens in real-time. Often, we offload heavy processing to background workers. Mermaid's `par` (parallel) and `loop` blocks are perfect for this. Consider a scenario where, after an order is placed, we need to send an email and update analytics simultaneously.
The `par` block visually demonstrates that the Email Worker and Analytics Worker are operating independently of each other. This is a common pattern in Event-Driven Architectures (EDA). The `loop` block inside the analytics worker indicates that the write operation might be retried upon failure.
Advanced Configuration: Actors and Grouping
For very large systems, you can group participants using `box`. This helps visually separate different domains, such as 'External Services' vs 'Internal Infrastructure'.
box "Internal Network" #f9f9f9
participant A as Service A
participant B as Service B
end
box "External Vendors" #ffe0b2
participant C as Twilio
participant D as Stripe
end
This simple organizational trick makes large sequence diagrams significantly more readable for stakeholders who might not know the intimate details of every service name.
Resilience Patterns and Observability
Sequence diagrams shine when explaining resilience patterns—circuit breakers, bulkheads, retries. Include log/trace spans in your diagram text to help SREs correlate visual flows with telemetry.
- Mark external calls with latency budgets (e.g., `<200ms SLA>`).
- Show retry/backoff loops explicitly to align with SRE runbooks.
- Annotate critical paths with log keys or trace IDs you expect to see in APM tools.
Production Handoff Checklist
Before shipping a new distributed workflow, export the sequence diagram to your incident response doc. Validate every actor has owners, dashboards, and alerts. This makes on-call rotations calmer and reduces MTTR when incidents hit.